| Skip Navigation Links | |
| Exit Print View | |

|
Managing Services and Faults in Oracle Solaris 11.1 Oracle Solaris 11.1 Information Library |
| Skip Navigation Links | |
| Exit Print View | |

|
Managing Services and Faults in Oracle Solaris 11.1 Oracle Solaris 11.1 Information Library |
1. Managing Services (Overview)
Notification of Faults and Defects
Displaying Information About Faults or Defects
How to Display Information About Faulty Components
How to Identify Which CPUs Are Offline
The Oracle Solaris Fault Management feature provides an architecture for building resilient error handlers, structured error telemetry, automated diagnostic software, response agents, and structured messaging. Many parts of the software stack participate in Fault Management, including the CPU, memory and I/O subsystems, Oracle Solaris ZFS, an increasing set of device drivers, and other management stacks.
FMA is intended to help with problems that can occur on an Oracle Solaris system. The problem could be a fault, meaning that something that used to work but no longer does. The problem could be a defect, meaning that it never worked correctly. In general, hardware can experience both faults and defects. However, most software problems are defects or are caused by configuration issues.
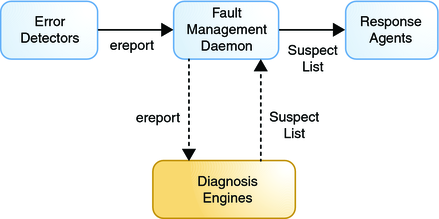
At a high level, the Fault Management stack contains error detectors, diagnosis engines, and response agents. Error detectors, as the name suggests, detect errors in the system and perform any immediate, required handling. Error detectors issue well-defined error reports, or ereports, to a diagnosis engine. A diagnosis engine interprets ereports and determines whether a fault or defect is present in the system. When such a determination is made, the diagnosis engine issues a suspect list that describes the resource or set of resources that might be the cause of the problem. The resource might or might not have an associated field-replaceable unit (FRU), a label, or an Automatic System Reconfiguration Unit (ASRU). An ASRU may be immediately removed from service to mitigate the problem until the FRU is replaced.
When the suspect list includes multiple suspects, for example, if the diagnosis engine cannot isolate a single suspect, the suspects are assigned a probability as to each suspect being the key suspect. The probabilities in this list add up to 100 percent. Suspect lists are interpreted by response agents. A response agent attempts to take some action based on the suspect list. Responses include logging messages, taking CPU strands offline, retiring memory pages, and retiring I/O devices.
Error detectors, diagnosis engines, and response agents are connected by the Fault Manager daemon, fmd, which acts as a multiplexor between the various components, as shown in the following figure.

The Fault Manager daemon is itself a service under SMF control. The service is enabled by default and controlled just like any other SMF service. See the smf(5) man page for more information.
The FMA and SMF services interact with each other when appropriate. Certain hardware problems can cause services to be stopped or restarted by SMF. Also, certain SMF errors cause FMA to report a defect.